G2252
Beef Feedlot Nitrogen Management
This NebGuide offers recommendations for managing nitrogen (N) in the beef feedlot.
Matt K. Luebbe, Extension Beef Feedlot Specialist
Galen E. Erickson, Extension Beef Feedlot Specialist
Andrea K. Watson, Animal Science Research Assistant Professor
- Reducing N intake by utilizing the MP system.
- Increase carbon on the pen surface.
- Increase pen cleaning frequency.
- Stockpiling manure vs. composting.
- Apply manure on a 4-year P-Basis rather than annual N-Basis.
- Conclusions
Feedlot cattle protein requirements are about 12.5 percent to 13.5 percent of diet dry matter (DM). Distillers grains contain about 30 percent crude protein, and currently are fed as an energy source rather than protein source. Therefore feeding greater dietary concentrations allows producers to easily meet dietary protein requirements. Once animal protein requirements are met, however, excess N is excreted. Excess N excreted on the pen surface has the potential of being volatilized. Volatilization of NH3 (ammonia) and N2O (nitrous oxide) contribute to greenhouse gas emissions, which are regulated by the Environmental Protection Agency. Producers can make management decisions that reduce the amount of N volatilized into the atmosphere, and to utilize manure as a valuable fertilizer.
In producing distillers grains plus solubles (DGS) from corn, starch is fermented into alcohol and CO2; this concentrates the remaining nutrients, including N, by three times. As a result, DGS contains about 30 percent CP. Table I shows the nutrient composition of commonly used feed ingredients.
Table I. Nutrient Composition (% of DM). |
|||
| Feedstuff1 | % DM |
% CP |
% P |
| DRC | 86 |
9.0 |
0.32 |
| WCGF | 44.7 |
19.5 |
0.66 |
| Sweet Bran | 60.0 |
24.0 |
0.99 |
| DDGS | 90.4 |
33.9 |
0.81 |
| MDGS | 46.2 |
30.6 |
0.84 |
| WDGS | 34.9 |
31.0 |
0.84 |
| CCDS | 32.5 |
23.5 |
1.72 |
| Steep | 49.4 |
35.1 |
1.92 |
| 1DRC=dry rolled corn, WCGF=wet corn gluten feed, Sweet Bran is Cargill wet corn gluten feed, DDGS=dry distillers grains plus solubles, MDGS=modified distillers grains plus solubles, WDGS=wet distillers grains plus solubles, CCDS=condensed corn distillers solubles (corn syrup), Steep = steep liquor from wet milling plants | |||
As DGS inclusion increases in the diet, N intake increases while retention remains the same. Consequently, N excretion increases with increasing levels of DGS. Two studies conducted during the winter and summer evaluated the inclusion of DGS at 15 percent and 30 percent of the diet, and its effects on N mass balance. Tables II and III show intake, retention, and excretion of N, represented as lb/steer. Nutrient excretion is calculated by subtracting the amount of nutrient retention from the amount of intake. This includes the amount of nutrient in the manure, runoff, and what may leach into the soil. When DGS are fed in finishing diets at higher levels, the amount of carbon on the pen surface increases. This helps to reduce N losses (discussed in a later section of this NebGuide).
Table II. Effect of dietary treatment on N mass balance during WINTER.a |
|||
| Dietary Treatmentb | CON |
15 |
30 |
| N intake | 69.4 |
79.8 |
98.4 |
| N retention | 12.2 |
12.7 |
13.0 |
| N excretionc | 57.1 |
67.1 |
85.3 |
| Manure N | 25.2 |
24.0 |
38.1 |
| N lost | 30.9 |
42.0 |
45.5 |
| aValues are expressed as lb/steer over 167-day feeding period. bCON=Control corn-based diet with no DGS, 15=15% DGS (DM basis), 30=30% DGS (DM basis). cExcretion=Intake-Retention |
|||
Table III. Effect of dietary treatment on N mass balance in SUMMER.a |
|||
| Dietary Treatmentb | CON |
15 |
30 |
| N intake | 63.8 |
78.3 |
94.6 |
| N retention | 10.1 |
10.9 |
10.8 |
| N excretionc | 53.6 |
67.3 |
83.9 |
| Manure N | 19.8 |
21.3 |
22.1 |
| Lost | 31.2 |
44.1 |
58.4 |
| aValues are expressed as lb/steer over 133-day feeding period. bCON=Control corn-based diet with no DGS, 15=15% DGS (DM basis), 30=30% DGS (DM basis). cExcretion=Intake-Retention |
|||
As DGS is included in the diet, N intake increases. Because N retention does not increase at the same magnitude as intake, excretion increases with inclusion of DGS. Because excess N is excreted on the pen surface, a portion is volatilized and not removed in the manure.
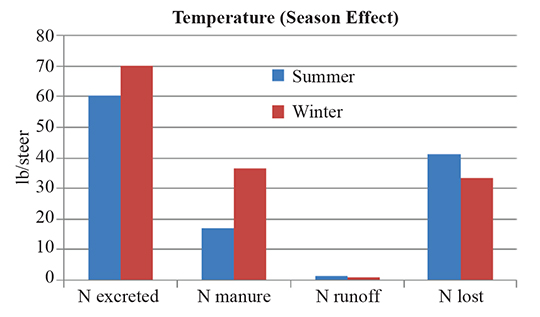
Nitrogen volatilization is greater in the summer than in the winter. About 55 percent of N is lost via volatilization in the winter, and about 75 percent is lost in the summer due to effects of temperature (Figure 1).
 |
Figure 1. Effect of temperature on N mass balance. |
Methods to manipulate the fate of N:
- Reducing N intake by utilizing the metabolizable protein (MP) system.
- Increase carbon on the pen surface.
- Increase pen cleaning frequency.
- Manure stockpiling and composting.
Reducing N intake by utilizing the MP system.
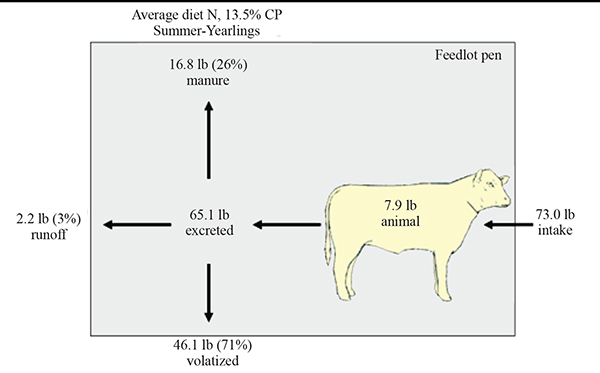
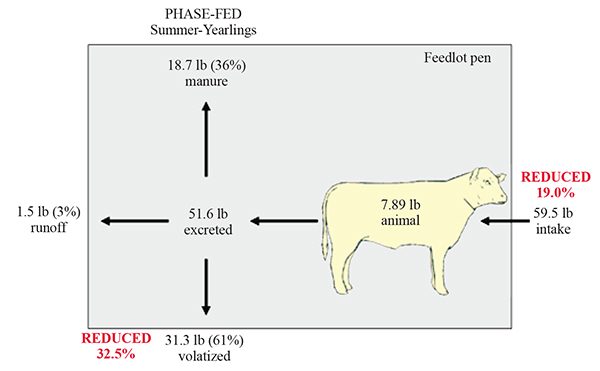
The MP system presented in the 1996 Nutrient Requirements of Beef Cattle (NRC) allows producers to more accurately formulate feedlot diets so that requirements are met and protein is not oversupplied. This will reduce N excretion and losses. Protein requirements change during the feeding period as cattle mature. When diets are formulated to meet degradable intake protein (DIP) and undegradable intake protein (UIP), requirements using the NRC, N intake, excretion, and volatilization decreases. Figures 2 and 3 show that reducing N intake by 19 percent results in 32.5 percent less N volatilized.
 |
Figure 2. Cattle fed a 13.5 percent corn control diet and the effect on N mass balance. |
 |
Figure 3. Cattle fed to meet and not exceed protein requirements throughout the feeding period, and the effect on N mass balance. |
Increase carbon on the pen surface.
Adding carbon (C) to the pen surface may increase the C:N ratio of feedlot manure and trap more N to reduce volatilization losses of NH3 and N2O. Increasing C on the pen surface can be achieved by feeding less digestible diets or adding C (i.e. bedding) during the winter. Cornstalk residue, sawdust, and straw are bedding options. However, at this time crop residues are valued more as a feed source than as bedding. Feeding a less digestible energy source increases the amount of organic matter (OM) on the pen surface, which increases the amount of N recovered in the manure. The consequences of feeding a less digestible energy source are reduced animal performance and an increase in the amount of manure on the pen surface. These diets may have higher roughage, gluten feed, or corn bran inclusion levels.
Increase pen cleaning frequency.
Increasing pen cleaning frequency reduces total N loss to the environment. When pens are cleaned monthly compared with cleaning at the end of the feeding period, the amount of manure N almost doubles. Monthly cleaning can reduce total N loss to the environment by an average of 14 percent. When manure is allowed to collect on pen surfaces during the entire feeding period, more N is exposed to the environment and be available for volatilization.
Stockpiling manure vs. composting.
Stockpiled manure appears to have greater value as a fertilizer, compared with composted manure. Stockpiling manure results in greater total N recovered in manure and available for crops. Depending on management and weather, dry matter losses and moisture content are similar between the two methods. Added costs for management, labor, land, and equipment may not be offset by decreased transportation cost to the field. When these factors are coupled with nutrient loss, anaerobic stockpiling of feedlot manure may, in some situations, be more economically favorable than composting.
Decreasing N volatilization leads to greater manure N, which can be utilized as a valuable fertilizer. Table IV illustrates the value, cost, and net return of manure from a corn-based diet compared to one containing DGS during the summer and winter at three N volatilization rates. Distillers grain diets show greater values of manure by an average of about $6.75/steer, compared to corn-based diets. However, there is also greater labor, machinery, and operating costs associated with manure from DGS diets. Nonetheless, DGS diets yield greater net returns of about $4.50/steer on average. Manure is more valuable when less N is volatilized. The most valuable manure in these scenarios is from steers fed a DGS diet with only 20 percent of N lost via volatilization.
Table IV. Manure Economics: Comparing corn-based to DGS diet at 70, 50, 20% N loss. |
|||
Manure Value |
Spreading Cost |
Net Value |
|
| Summer (70% N Loss) Corn (13.0% CP; 0.3% P) DGS (18.2% CP; 0.5% P) |
$12.42 $17.86 |
$7.22 $8.40 |
$5.20 $9.46 |
| Winter (50% N Loss) Corn (13.0% CP; 0.3% P) DGS (18.2% CP; 0.5% P) |
$14.78 $21.34 |
$8.98 $10.92 |
$5.80 $10.42 |
| Other (20% N Loss) Corn (13.0% CP; 0.3% P) DGS (18.2% CP; 0.5% P) |
$18.34 $26.58 |
$11.36 $14.46 |
$6.98 $12.12 |
| Values expressed as $/steer Assumptions: 5,000 head feedlot; 750-1,300 lb steer; 23 lb DMI; 144 DOF; 100 head/pen; open lot; winter; 80 acre fields; 50% in crops; 50/50 corn and soybean; corn yield = 120 bu/acre; soybean yield = 35 bu/acre; $0.40/lb N; $0.27/lb P2O5; $0.20/lb K2O. |
|||
Apply manure on a 4-year P-Basis rather than annual N-Basis.
If manure is applied every year to the same ground on an N basis, P is being over-applied by three to six times. Land required for P-based applications typically increases by a factor of about four over N-based applications. Table V illustrates that manure from cattle fed a wet distillers grains plus solubles (WDGS) diet in winter would require about 0.19 acres/head if applied on an annual N basis, compared to 0.80 acres/head on an annual P basis.
Land, expenses, and time needed for application increase when manure is applied annually on a P-basis compared to an N-basis ($29.04/head and $10.92/head respectively). However, when applying on a 4-year, P-basis the greatest value from manure if realized because of its ability to gain economic value for all of the P in manure. When all nutrients are valued, the increased value of manure may exceed the added cost of P-based application.
Phosphorus should be applied on a 4-year basis, which provides for multiple years of P in a single application. Applying on a 4-year, P-basis also meets crop requirements for N for one year. The following three years N should be applied followed by manure application again after four years. By implementing this method, manure nutrient potential is maximized and crop P requirements are met, without being exceeded. This is a more cost-efficient method.
Table V. Comparing manure economics from a WDGS diet with 50 percent N losses (Winter) when spread on 1-Year N, 1-Year P, or 4-Year P basis. |
|||||
Manure Economics 50% N loss, WDGS Diet |
|||||
$/head |
Acres/head |
||||
Value |
Spreading Cost |
Net |
Total Land |
Single Year |
|
| 1-Year N-Based | $21.34 |
$10.92 |
$10.42 |
0.19 |
0.19 |
| 1-Year P-Based | $21.34 |
$29.04 |
- $7.70 |
0.79 |
0.79 |
| 4-Year P-Based | $21.34 |
$11.76 |
$9.58 |
0.80 |
0.20 |
| Values expressed as $/steer Assumptions: 5,000 head feedlot; 750-1,300 lb steer; 23 lb DMI; 144 DOF; 100 head/pen; open lot; winter; 80 acre fields; 50% in crops; 50/50 corn and soybean; corn yield=120 bu/acre; soybean yield=35 bu/acre; $0.40/lb N; $0.27/lb P2O5; $0.20/lb K2O. |
|||||
Conclusions
As byproducts become more commonly used in feedlot diets, N intake and the amount of N excreted by the animal increases. However, if N is managed effectively through the feedlot, producers can reduce N lost via volatilization as well as benefit from utilizing manure as fertilizer.
Additional information can be found in UNL Extension publication G2250, Managing Manure Phosphorus from Feedlots; G2251; Impact of Feeding Phosphorus on Nutrient Management; and RP190, Impact of Feeding Distillers Grains on Nutrient Planning for Beef Cattle Systems.
This publication has been peer reviewed.
Visit the University of Nebraska–Lincoln Extension Publications website for more publications.
Index: Beef
Feeding and Nutrition
Issued December 2014