G2212
Getting to Know Your Pastures: Techniques to Enhance Monitoring
A photo-monitoring system and other monitoring techniques can help land managers achieve their pasture management objectives. Photo-monitoring can capture a vast amount of data, and other monitoring procedures can be added to measure quantitative goals.
Bethany M. Johnston, Extension Educator
Jay D. Jenkins, Extension Educator
Cynthia A. Tusler, Extension Educator
Jerry D. Volesky, Extension Range and Forage Specialist
- Why Monitor?
- Where to Monitor
- What Is Photo-Monitoring?
- When to Monitor
- What Type of Monitoring Should Be Done?
- Document Changes in Plant Density or Height, Abundance of Weedy Plants, Washouts, or Blowouts
- Records of Ground Cover, Plant Density, Plant Residue, or Plant Composition
- Forage Production
- Species Composition or Ecological Status and Health of Plant Communities
- Estimate of Potential Production and Plant Species. Provide a visual observation of the level of utilization (grazed vs. ungrazed) within a pasture.
- Set Up Next Year’s Grazing Rotations<
- Calculate Stocking Rate of Animals for a Pasture
- Summary
- Hints, Tips, and Basics of Photo-Monitoring
- Resources
Why Monitor?
Monitoring is key to rangeland and pasture management. You may have heard the phrase “you can’t manage what you don’t measure.” What do you want your pastures to look like? All managers should monitor to evaluate changes and progress toward management goals. Others may document pasture health for carbon credits, government programs, or absentee landowners. If you are receiving credit for improving pasture health, you may want to document your pasture and management. Records also can paint a long-term picture of production for realtors or lenders.
Grazing records should be included as part of the overall monitoring program. This includes grazing dates and stocking rates for each pasture. The UNL Extension Circular Grazing and Hay Records: Spreadsheet Template (EC165) is available as a tool for keeping grazing records. Plant growth is linked to precipitation, so it is important to record your precipitation amounts from October to September (the vegetation-year).
Where to Monitor
Choose a typical and representative area of a pasture to monitor. A uniform pasture may only need one photo point; complex pastures need more. For example, a hilly pasture with valleys would need two photo points — one on the hills and one in the valleys.
Areas to avoid:
- ungrazed or lightly used areas — steep hills, pasture corners, locations over 1 mile from water
- overused areas — less than ¼ mile from water, fence, or fence corners
- areas that funnel cattle movement — tight draws, cow trails.
What Is Photo-Monitoring?
Photo-monitoring is the simplest way to monitor short- or long-term changes in pasture and rangeland. This orderly collection, analysis, and interpretation of resource data can evaluate progress toward meeting management objectives quickly and easily. Photographs alone provide a wealth of information but must be accompanied with, for example, plant and weather data to realize the full potential. Photographs of the same site over time allow you to see differences at a glance. A photograph is truly “worth a thousand words.” Photo-monitoring is repeatable and makes it easy to compare year-to-year changes in vegetation cover, growth, and density. Photographs can show:
- the condition of the pasture;
- the type and abundance of species;
- ground cover and residual (standing herbage);
- erosion (wind or water);
- effects of fire, late freeze, drought, hail, grasshoppers; and
- healing of problem areas (washouts, control of cedar trees).
At a minimum, photographs should include a Photo Point and Photo Plot. For more intense monitoring, a Photo Point can be accompanied with several Photo Plots of that area. A picture is qualitative, so other methods are needed for quantitative data.
When to Monitor
Take photographs at least once a year after the growing season when the plants have matured. More frequent monitoring can show seasonal changes.
What Type of Monitoring Should Be Done?
The amount and intensity of monitoring is flexible and should be developed to match your individual ranch or pasture goals. The type of monitoring program you should use is the one that gives you the information you need in making management decisions. Data can be recorded and organized through photographs and handwritten notes, electronically on a computer, or by using the UNL Rangeland and Pasture Photo-Monitoring App called “GrassSnap.”
The following are examples of goals and monitoring procedures. Develop goals and choose monitoring techniques that match your production system.
Document Changes in Plant Density or Height, Abundance of Weedy Plants, Washouts, or Blowouts
How to Collect:
Photo Point: General landscape of key area(s). Landscape photographs include a large area looking out toward the horizon.
Find a representative area and place a field marker. Look out on the horizon and choose a point (could be a large hill or a dip in a valley) that can easily be located year after year. Use the same location every year (see Figures 1 and 2).
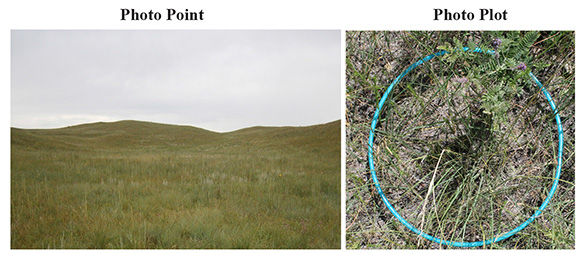 |
Figure 1. Photographs should include a pasture landscape scene (left) taken as a Photo Point and Photo Plot (right) to capture details of the grass and soil surface. |
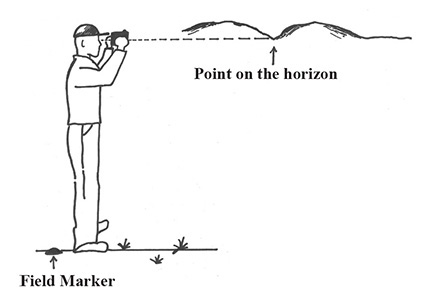 |
Figure 2. When taking a landscape photograph (a Photo Point), position yourself at the field marker and line up with an easily identifiable landmark (e.g., a dip in the hills). |
Equipment Needed:
Camera, GPS and/or field marker, compass, clipboard/paper/markers, perspective pole.
Field markers are used to mark the point in the pasture where the photographer stands. Try to avoid tall markers that could attract curious cattle or markers that could ruin tires. Short PVC pipe or steel fence posts driven into the ground, and flat metal disks are examples.
Perspective pole is used for easy reference of grass height and density. A 5-foot tube or shovel handle with alternating black and white stripes about 1 foot apart works well. Start with black on top, as the top of the pole will provide better contrast against the sky.
When taking the Photo Point image, place the perspective pole the same distance from the field marker. The purpose of the perspective pole is just that — to keep perspective in photographs taken over multiple years.
Records of Ground Cover, Plant Density, Plant Residue, or Plant Composition
How to Collect:
Photo Plot: A nearer photograph that gives more detail about a key area. The photograph is taken looking straight down at the grass and soil (Figures 1 and 3).
Photo Plots can be taken from the field marker used for the Photo Point image. Walk out a few steps and place a hoop or square on the ground. Look straight down and take a picture.
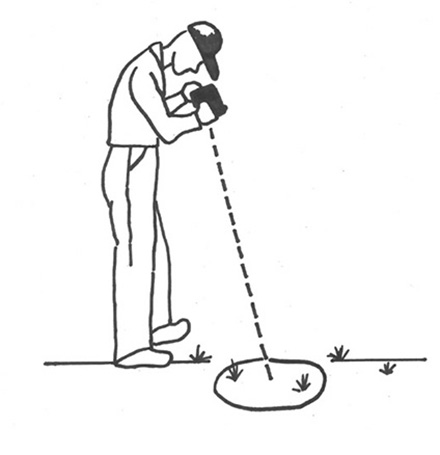 |
Figure 3. When taking a Photo Plot, look straight down at the ground. Try to keep your shadow and feet out of the picture. Optional: place your hoop or frame in the picture for size reference. |
Equipment Needed:
Camera, hoop or square (optional), GPS and/or field marker, compass, clipboard/paper/markers for reference in the picture. A hoop, or plot frame, can be made of any flexible material, usually tubing or rope. If the frame is 58.9 inches in circumference, the frame also can be used to measure pasture production as in the next example.
Forage Production
How to Collect:Clipping: A small area of forage is clipped, dried, and weighed to estimate total forage production (lb/ac).
- Place a frame of known size in a representative area. For our calculations, use a round plot frame (58.9-inch circumference).
- Ensure the frame is sitting directly on the soil surface.
- Clip to ground level only the forage plants rooted within the frame.
- Remove plants your animals won’t eat (noxious or unpalatable weeds).
- Measure the weight of an empty paper bag in grams.
- Place clipped forage in a bag.
- Dry forage for more accurate results.
Tip: The forage will dry in a few days if left on the dashboard of a vehicle. - Weigh the bag of forage in grams. Subtract the weight of the empty bag.
- If the forage is not dried, multiply by dry matter content percent to figure total dry matter per acre. Calculate dry weight (use NRCS charts to determine % DM).
- Multiply the dry weight minus the weight of the bag times 50 for total forage in pounds per acre.
Estimate of total forage = (Dry weight of forage in bag in grams – weight of bag in grams) × 50
- Divide by 4 for a rough estimate of grazable forage in pounds per acre.
Estimate of grazable forage =
(Dry weight of forage in bag in grams – weight of bag in grams) × 50 |
4 |
Note: An approximate stocking rate can be calculated from production data. Contact an Extension or NRCS office for information.
Clipping multiple samples from different locations will provide a better estimate of average pasture production.
When determining annual forage production on most types of pasture, clipping an ungrazed area in August or later is recommended to best represent that season’s growth.
Drying charts only give an estimate of percent moisture, so drying the clippings is the most accurate way to measure dry matter.
Equipment Needed:
Hoop or square, clippers, scale that measures grams, paper bags, oven or dashboard for drying (Figure 4).
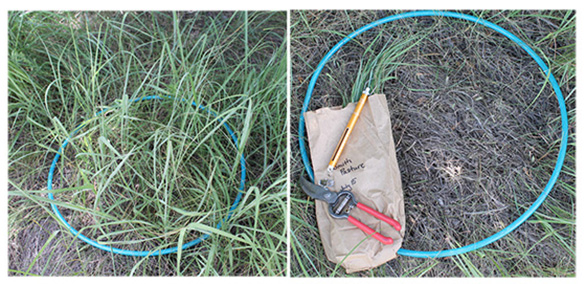 |
Figure 4. Find a representative area and place your plot frame (left). Clip plants rooted in the plot frame. Follow the instructions to estimate forage production. |
Species Composition or Ecological Status and Health of Plant Communities
How to Collect:
Plant Identification — Identify key forage species that should be or are desirable to have in your pastures. Look up characteristics to identify plants, or take pictures or samples to be identified. Some plants may require help from your local extension office to identify. Place samples in a resealable plastic bag and refrigerate for best preservation.
Equipment Needed:
Plant identification book or website; NRCS ecological site descriptions for plant communities.
Estimate of Potential Production and Plant Species. Provide a visual observation of the level of utilization (grazed vs. ungrazed) within a pasture.
How to Collect:
“Fishbowl” or exclosure: Fence off a small exclosure. Small flexible panels and steel poles would be sufficient (Figure 5). Plant composition and production can be estimated in the exclosure where animals are unable to graze. Keep exclosures at the same location for a maximum of two years before moving.
Equipment Needed:
Fence or small panels, posts (Figure 5).
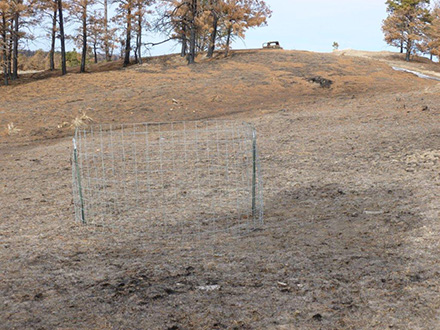 |
Figure 5. A simple exclosure built to monitor the recovery of a burned pasture. |
Set Up Next Year’s Grazing Rotations
How to Collect:
Grazing indexes: find a grazing index for your type of pasture/plant community.
It may take time to understand how to use indexes. An example is the Sandhills Defoliation and Response System (SanDRIS) for the Sandhills region (see Resources).
Fill out the required information. Use it to develop next year’s planned rotations for optimal pasture health.
Every index is different, so read carefully before using.
Equipment Needed:
Grazing records and dates grazed, precipitation records, residual/litter. Number of head and estimated weights of animals also should be included. Data sheet for recording.
Calculate Stocking Rate of Animals for a Pasture
How to Collect:
Grazing and production records — Demand can be calculated with the following data: number of head, size and kind of animal, and length of time in a pasture. See “clipping” for estimating production in a pasture.
Equipment Needed:
Data sheet or electronic version for grazing, calculator. Electronic grazing records to help balance stocking rates are available in Excel® in the UNL Extension Circular Grazing and Hay Records (EC165).
Summary
A good photo-monitoring system will help land managers stay on track with their goals. Pictures capture a vast amount of data as Photo Points and Photo Plots. Other methods can be added to measure quantative goals, such as clipping for production and plant identification. Personalize your monitoring so the data you collect will be useful in your range management. Remember to monitor what you want to manage and develop a custom system to fit.
Resources
Grassland Snapshot (GrassSnap)
UNL Rangeland and Pasture Photo-Monitoring App. 2013.
Skillful Grazing Management on Semiarid Rangelands, EC162, http://www.ianrpubs.unl.edu/sendIt/ec162.pdf
Grazing and Hay Records: Spreadsheet Template, EC165, http://www.ianrpubs.unl.edu/sendIt/ec165.pdf
Integrating Management Objectives and Grazing Strategies on Semiarid Rangeland, EC158, http://www.ianrpubs.unl.edu/sendIt/ec158.pdf
Sandhills Defoliation Response System (SanDRIS), http://drought.unl.edu/ranchplan/BeforeDrought/GrazingStrategy/DecisionSupportToolsforGrazing/SandhillsDefoliationResponseIndex.aspx
Common Grasses of Nebraska: Prairies, Rangelands, Pasturelands, EC170, http://www.ianrpubs.unl.edu/epublic/pages/publicationD.jsp?publicationId=740
Forbs and Shrubs of Nebraska, EC118, http://www.ianrpubs.unl.edu/epublic/pages/publicationD.jsp?publicationId=925
Grassland Plants of South Dakota and the Northern Great Plains. James R. Johnson and Gary E. Larson. August 2007.
Weeds of the West. Tom D. Whitson et al. 5th edition, 1996.
NRCS Drying Chart. http://efotg.sc.egov.usda.gov/references/public/NE/NE-ECS-9_Similarity_Index_Worksheet.pdf
This publication has been peer reviewed.
DisclaimerReference to commercial products or trade names is made with the understanding that no discrimination is intended of those not mentioned and no endorsement by University of Nebraska–Lincoln Extension is implied for those mentioned. |
Visit the University of Nebraska–Lincoln Extension Publications website for more publications.
Index: Range & Forage
Pasture Management
Issued October 2013