G1658
How to Use the National Genetic Evaluations for Somatic Cell Scores
This NebGuide will help dairy producers use information from the National Genetic Evaluations for Somatic Cell Scores in selecting sires.
Jeffrey F. Keown, Extension Dairy Specialist
Paul J. Kononoff, Extension Dairy Specialist
|
Genetic evaluations for Somatic Cell Scores (SCS) were first published in July 1993. This evaluation system allows producers to select sires genetically for SCS. This system uses national data that is analyzed by USDA. The procedures used are the same as the current evaluation system for milk, fat and protein.
In order to fairly evaluate any genetic evaluation, look at the heritability of the trait, as well as its genetic correlation to other production traits. The heritability of SCS is approximately 9 percent. This can be compared with a heritability for milk production of 25 to 30 percent. Therefore, it will be more difficult to improve the SCS of the herd through selection than to improve milk production.
Limited research shows a genetic correlation of .30 between milk yield and an increase in mastitis. Therefore, selecting high milk yield sires may increase the incidence of mastitis in the herd. This leads to two concerns: how much of an increase in mastitis can be expected, and over what period of time? The incidence of mastitis, if you selected entirely on milk production, would be expected to be .3 to .9 percent per year. Putting these figures in perspective means that if your herd currently has 30 percent incidence of mastitis, you could expect to have between 33 to 39 percent infected in 10 years. Therefore, you must decide if it is worthwhile to select on the SCS evaluation.
The major way to alter the Somatic Cell Count of a herd is through management changes, not through genetic selection. You should not lower the selection pressure on production traits in order to select on SCS. Changing a herd genetically for low heritability traits is a slow process, especially when management changes can alter the system almost overnight. If selecting SCS, sires should be selected first on production traits and then sires that have above average SCS PTAs should be eliminated. In other words, use SCS PTAs as a culling criteria once production limits have been selected. This procedure will not decrease your emphasis on production traits and will still let a producer use a group of low SCS sires.
|
||||||||||||||||||||||||||||
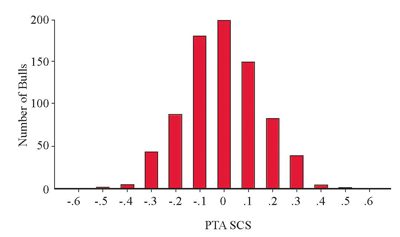
The evaluations are not reported as the familiar 100,000 or 200,000 cell counts. The evaluations are put on a log scale in order to compare sires. This log scale is reported on the DHI 228 Somatic Cell report. This need not be confusing since the figures published are positive and negative. A negative value means the sires’ daughters have a lower SCS than other sires. A positive value means the sires’ daughters have a higher SCS score than the average sire. Figure 1 shows the distribution of PTA SCS for 774 Holstein sires. As can be seen from the graph, the majority of sires are between -.1 and +.1 for SCS PTAs. Therefore, the range on sires is going to be quite small.
Another listing of importance is the SCS PTAs on sires that most A.I. organizations are using to sire the next generation of bulls. Table I shows the top 10 sires of sons and their PTA for SCS. The average PTA SCS on these 10 sires is -.07. The poorest sire is +.33 while the best sire is -.28. In conclusion, the SCS evaluation can be used as another tool in screening A.I. sires for use in your herd. Remember to select sires on production first and then screen on other traits, such as SCS evaluations. Improved management will lower SCS more rapidly than genetic changes.
Additional dairy information can be found at http://www.nebraskadairy.unl.edu.
Visit the University of Nebraska–Lincoln Extension Publications Web site for more publications.
Index: Dairy
Breeding and Reproduction
Issued January 2007
