
Bruce I. Dvorak, Extension Environmental Infrastructure Engineer
Elizabeth M. Regier, Graduate Student
Nearly all wastewater treatment plants have opportunities to improve their energy efficiency and reduce their costs. Many operators and municipal managers want to know what opportunities they might find before undergoing an internal or external assessment. Benchmarking allows them to see how their facility compares with other wastewater plants while still taking factors like influent loading and flow rates into account.
The Portfolio Manager® benchmarking tool is an ENERGY STAR® tool developed by the U.S. Environmental Protection Agency (EPA). The Portfolio Manager can score wastewater plants with greater than 0.6 MGD (million gallons per day) of wastewater influent, but it is most reliable for facilities with influent flows greater than or equal to 1 MGD.
In 2016, the University of Nebraska–Lincoln (UNL) developed a methodology to benchmark small Nebraska wastewater (SNW) facilities operating at less than 1.5 MGD. More specifically, the methodology is designed to best serve non-lagoon and non-fixed-film plants operating under 0.6 MGD.
Hyperlinks to resources, like portfolio manager, at www.energystar.gov, are located throughout this NebGuide and are also listed at the end with their respective URLs.
The Portfolio Manager benchmarking tool can compare the energy efficiency of nearly any building or facility with similar entities nationwide. After creating an account and putting relevant data into the system, the benchmarking tool will give a percentile-based score between 0 and 100, with 0 indicating some of the lowest energy efficiency and 100 indicating the highest energy efficiency nationwide.
Portfolio Manager is designed to be both powerful and user-friendly. Three steps demonstrate how to find and interpret an ENERGY STAR score.
The Portfolio Manager benchmarking tool requires the following pieces of information as inputs:
ENERGY STAR has created a worksheet that simplifies the collection of this information as well as a glossary of terms.
Here are a few tips for gathering data:

Not including the time needed to gather bills, an individual who is knowledgeable about the plant’s operations will be able to fill out the worksheet in an hour or less.
New users must create an account at www.energystar.gov/portfoliomanager. ENERGY STAR has created the Portfolio Manager Quick Start Guide to help users enter their plant’s information into the benchmarking tool once they have created an account and logged in. There is also a training section with how-to guides, videos, and webinars to help operators and managers benchmark their facilities.
Here are some tips for putting data into the system:
Users can anticipate that initial data entry will require two to three hours.
Once the necessary data has been entered into Portfolio Manager, a percentile-based score between 0 and 100 is calculated. A score of 100 indicates extremely high efficiency, while a score of 0 indicates extremely low efficiency. A wastewater operator or municipal manager can use this score to determine what steps he or she should take regarding energy efficiency.
Facilities can also use Portfolio Manager to track their energy performance over time. If newer data reflect better energy efficiency, operators and managers will be able to see the plant’s score increase over time.
ENERGY STAR (www.energystar.gov) has more information on Portfolio Manager and the methods and data they used to create it in their Data Trends, Technical Reference, and Utility Access Fact Sheet documents.
While the ENERGY STAR Portfolio Manager tool is equipped to benchmark wastewater facilities operating at more than 0.6 MGD, the university has developed equations for Nebraska facilities treating less than 1.5 MGD. These equations are recommended for plants operating under 0.6 MGD, and are not valid for fixed-film or lagoon systems.
The ENERGY STAR and SNW models have some other major differences. First, while Portfolio Manager more strongly resembles a black-box tool, a person using SNW equations will perform the calculations manually. Second, while Portfolio Manager gives a percentile score between 0 and 100 (100 being the most efficient), the SNW score is based on a ratio of the actual energy use of the plant to the energy use that would be expected based on previous benchmarking. The lower the SNW score is, the more efficient the plant is. Additionally, SNW equations featured herein are only valid for plants that primarily use electrical energy. Operators and managers who want to benchmark small wastewater plants that use a significant amount of natural gas or other non-electric energy should request assistance from the Nebraska Industrial Assessment Center (NIAC) or their consulting engineer.
The basis for the SNW model is the energy intensity of a wastewater plant. Energy intensity is the amount of energy needed to treat a certain volume of wastewater. Here, the unit for energy intensity is Megawatt hour per million gallons (MWh/MG). The model was developed after studying the energy intensity of 83 wastewater plants in Nebraska and 71 wastewater plants in Pennsylvania.
Researchers found that they could not base a fair, useful benchmarking process on average energy intensity alone. Factors such as the presence of extended aeration or the influent of Carbonaceous Biochemical Oxygen Demand (CBOD5) will affect the energy intensity of a wastewater plant, regardless of how well the operators maximize their energy efficiency. The SNW equations take these factors into account to give operators and municipal managers a better way to compare the efficiency of their wastewater plants with those in the study.
The following three steps demonstrate how to calculate and interpret the results of the SNW model.
The SNW equations require the following information as inputs:
SNW computations will also require the use of the natural logarithm and ex functions. Therefore, a calculator or spreadsheet program capable of performing these functions will be necessary.
The following equations use some alphabet symbols to represent certain pieces of information. Here is a list of what these symbols represent.
The first thing to calculate is the portion design flow ratio, which the following equation gives as a decimal.

Next, calculate the predicted electric intensity of the plant using a regression equation developed based on data from Nebraska plants.
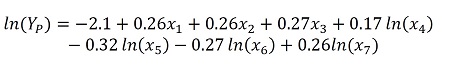
The best way to use this in practice is to compute everything on the right side of the equation first, which will make the equation look similar to this:
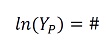
Then, we can take e to the power of each side of the equation, making it look like this:

In this case, Yp is the average energy intensity of a plant in Nebraska with similar characteristics. The units of Yp are MWh (kWh*1000) per million gallons of flow, or MG. After calculating the plant’s predicted electric intensity, calculate its actual electric intensity. First, use the electric bills to find the total number of kWh used during the 12 months of data. This will probably look something like this:

Next, find the total annual flow of the plant. Generally, the simplest calculation is
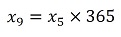
where 365 is the number of days per year. Those who have 12 months of monthly averages can also use this method. Note that the numbers 31 and 28 refer to the number of days in the respective month.

Once the annual electric usage and total annual flow have been calculated, the actual energy intensity of the plant can be found as shown.

The final calculation is the percent average Nebraska facility, which is also referred to as the SNW score. It is simply the actual energy intensity of the plant divided by the predicted energy intensity, then multiplied by 100 to convert the number to a percent.
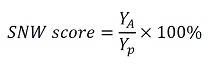
The percent average Nebraska facility describes how much energy a plant is using compared with what a Nebraska operator would expect to use. A score of 100 percent means that the plant is running exactly as efficiently as the average Nebraska plant. A value over 100 percent means that the plant is less efficient than would be expected, while a score between 0 and 100 percent indicates that the plant is more efficient than average. A negative score indicates a mathematical error or an over-extrapolation of the equation. The following guidelines give managers and operators a better idea of how to interpret and use their SNW score.
Facilities can track their scores over time to determine if their energy performance is improving their energy efficiency by seeing if their score is decreasing over time.
While every plant has different opportunities for improvement, here are some common suggestions for how small wastewater facilities can improve their energy efficiency:
Those reading printed versions of this document can type the following addresses into an internet browser to find the hyperlinked items. The external links will contain the most current information, but the authors cannot ensure that they are operational as external parties maintain them. The authors work to keep NIAC links as current and operational as possible, but some information may be outdated.
|
Portfolio Manager |
|
|
Portfolio Manager training section |
|
|
ENERGY STAR glossary |
|
|
Portfolio Manager worksheet |
https://portfoliomanager.energystar.gov/pm/dataCollectionWorksheet |
|
Portfolio Manager Quick Start Guide |
https://www.energystar.gov/buildings/tools-and-resources/portfolio-manager-quick-start-guide |
|
Portfolio Manager Data Trends |
|
|
Portfolio Manager Technical Reference |
|
|
Portfolio Manager Utility Access Fact Sheet |
|
Free Map Tools area calculator |
|
|
Google Maps |
This publication has been peer reviewed.
UNL Extension publications are available online at http://extension.unl.edu/publications.
Extension is a Division of the Institute of Agriculture and Natural Resources at the University of Nebraska–Lincoln cooperating with the Counties and the United States Department of Agriculture.
University of Nebraska–Lincoln Extension educational programs abide with the nondiscrimination policies of the University of Nebraska–Lincoln and the United States Department of Agriculture.
Copyright © 2018, The Board of Regents of the University of Nebraska on behalf of the University of Nebraska–Lincoln Extension. All rights reserved.