Learn how to use a simplified psychrometric chart to better understand the relationships between air temperature and relative humidity.
David P. Shelton, Extension Agricultural Engineer
Air is a vital component of our everyday lives. Air properties are important whether we are ventilating a livestock housing unit, drying grain, or determining relative humidity in the home. In a livestock building, temperature, moisture, odors, and toxic or noxious gases must be controlled. Since the moisture holding capacity of air increases as temperature increases, heat may be added in grain drying to help remove moisture from the grain kernel. In the home, moisture either can be added to or removed from the air to change the relative humidity. In each case, air provides the link between the controls and the mechanical equipment, and air properties influence the results of the processes.
Psychrometrics refers to the properties of moist air. A psychrometric chart graphically illustrates the relationships between air temperature and relative humidity as well as other properties. A better understanding of air properties and the psychrometric chart can aid in the selection and management of a livestock building ventilation system, a grain drying system, or a home humidifier.
Three primary definitions are used to describe air under various conditions:
Due to the variability of atmospheric air, the terms dry air and moist air are used in psychrometrics. For practical purposes, moist air and atmospheric air can be considered equal under the range of conditions normally encountered.
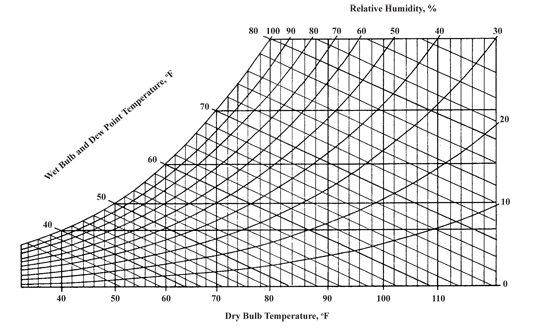
At first glance, even a simple psychrometric chart appears complex (Figure 1). However, separating the various lines and scales on the chart simplifies understanding of their location, meaning, and use.
|
| Figure 1. Simplified psychrometric chart for temperatures and relative humidities. |
Air Temperature
Air temperature is a measure of the heat content of air. Three different temperature measurements are used in the psychrometric chart:
| 1. | Dry bulb temperature is the air temperature determined by an ordinary thermometer. Dry bulb temperature is given in weather reports. The dry bulb temperature scale is located at the base of the chart. Vertical lines indicate constant dry bulb temperature (Figure 2). |
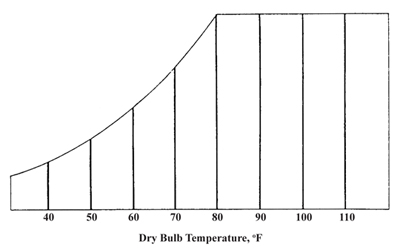 |
| Figure 2. Dry bulb temperature lines. |
2. |
Wet bulb temperature reflects the cooling effect of evaporating water. This effect is often used to cool livestock buildings and some homes, and is the cooling process when we perspire. Wet bulb temperature can be determined by passing air over a thermometer that has been wrapped with a small amount of moist cloth. The cooling effect of the evaporating water causes a lower temperature compared to the dry bulb air temperature. The wet bulb temperature scale is located along the curved upper left portion of the chart. The sloping lines indicate equal wet bulb temperatures (Figure 3). |
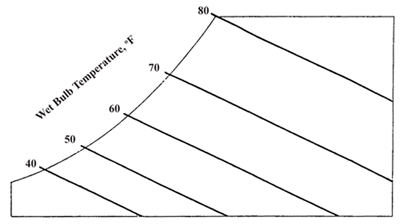 |
| Figure 3. Wet bulb temperature lines. |
| 3. | Dew point temperature is the temperature below which moisture will condense out of air. Air that is holding as much water vapor as possible is saturated or at its dew point. Water will condense on a surface, such as a building wall or pitcher of ice water, that is at or below the dew point temperature of the air. The dew point temperature scale is located along the same curved portion of the chart as the wet bulb temperature scale. However, horizontal lines indicate equal dew point temperatures (Figure 4). |
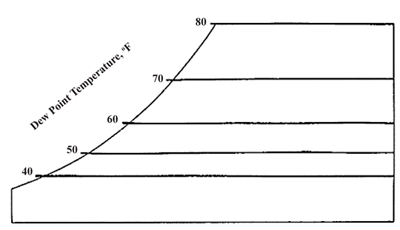 |
| Figure 4. Dew point temperature lines. |
Relative Humidity
As the name implies, relative humidity is a measure of how much moisture is present compared to how much moisture the air could hold at that temperature. Relative humidity, which is expressed as a percent, is given in weather reports. Lines representing conditions of equal relative humidities sweep from the lower left to the upper right of the psychrometric chart. The 100 percent relative humidity (saturation) line corresponds to the wet bulb and the dew point temperature scale line. The line for zero percent relative humidity falls along the dry bulb temperature scale line (Figure 5).
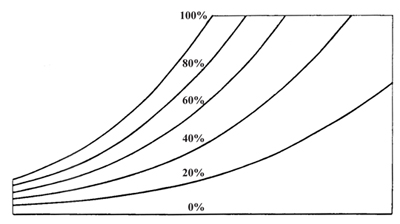 |
| Figure 5. Relative humidity lines. |
The versatility of the psychrometric chart lies in the fact that by knowing just two properties of moist air, the other properties can be determined. The following examples will help show how the chart is used.
|
||||||
Example 1
Question: Moist air is at 80°F (dry bulb) and 50 percent relative humidity. What are the other properties of this air?
Answer: First locate the intersection of the 80°F dry bulb temperature line and the 50 percent relative humidity line. From this intersection, follow the appropriate lines to the correct scales (Figure 6). Table I lists the determined properties.
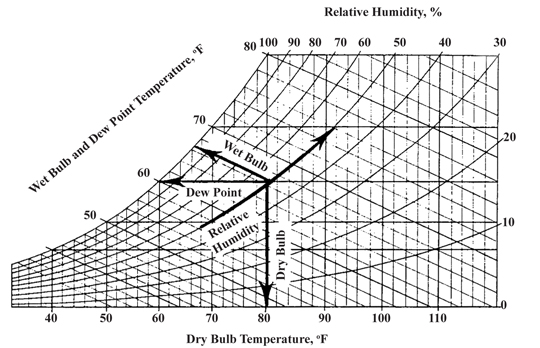 |
| Figure 6 Location of properties for Example 1. |
Example 2
Question: The air in a swine nursery building has a dry bulb temperature of 80°F and is at 70 percent relative humidity. How warm do the walls have to be to prevent condensation?
Answer: In this example, we need to know the dew point temperature. Locate the intersection of the 80°F dry bulb temperature line and the 70 percent relative humidity line. Proceed horizontally to the left until the dew point temperature scale is intersected. This gives the dew point temperature as 69°F. The wall temperatures must be warmer than this to prevent condensation.
Example 3
Question: A swine producer is considering installing evaporative cooling in a breeding herd building. What is the lowest temperature that can theoretically be obtained from the air coming off the cooling pads if the outside air has a 90°F dry bulb temperature and 35 percent relative humidity?
Answer: Locate the intersection of the 90°F dry bulb temperature line and the 35 percent relative humidity line (which is not shown on the chart, but is midway between the 30 and 40 percent lines). Since evaporative cooling is the same process that determines wet bulb temperature, follow the wet bulb temperature line upward and to the left until the wet bulb temperature scale is intersected. The lowest possible temperature for these conditions would be the wet bulb temperature of 69°F. However, due to the inefficiency of evaporative coolers, the temperature of the air coming off the cooling pads will be 3o-5°F above the wet bulb temperature. This producer can probably expect to obtain air at about 73°F from the evaporative cooler under these conditions. This air would also have a relative humidity of approximately 85 percent.
|
Example 4
Question: How can a homeowner check the home’s relative humidity in order to adjust a humidifier?
Answer: Relative humidity can be determined by using a sling psychrometer to measure wet and dry bulb temperatures and a psychrometric chart.
A sling psychrometer consists of two thermometers, one of which is equipped with a wick around the bulb. The other is used to measure dry bulb temperature. To use this instrument, the wick is saturated with clean water and the psychrometer is whirled for approximately 10 to 15 seconds. Repeat this process two or three times until there is no further temperature drop on the thermometer with the wick.
At this point, the wet bulb temperature (on the thermometer equipped with a wick) is noted to be 47°F. The dry bulb temperature thermometer reads 70°F. On the psychrometric chart, determine the intersection of the 70°F dry bulb line and 47°F wet bulb line. This intersection falls on the line representing 10 percent relative humidity. The humidifier should be adjusted upwards to maintain the relative humidity at 25 to 35 percent.
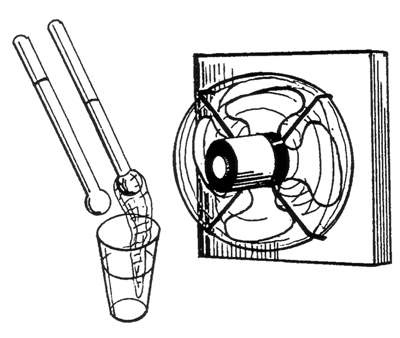
Another technique, which gives satisfactory results for most applications, is to use two standard thermometers and a fan. The bulb of one thermometer is equipped with an absorbent wick — a braided shoelace or heavy string will work. Wet the wick and place the end in a small cup of water. Place both thermometers on the intake side of the fan, where air is drawn across them (Figure 7). When the wick-equipped thermometer shows no further temperature drop, note the wet and dry bulb temperatures. Now use the psychrometric chart to determine relative humidity from these temperature measurements.
The psychrometric chart is a graphical presentation of air properties under a variety of conditions. Understanding the chart will allow you to use it as an aid in the design and management of a livestock building ventilation system, a grain drying system, or even a home humidifier.
This publication only provides a very simplified or abridged version of the psychrometric chart. A full chart also includes scales for absolute humidity or the weight of water per unit weight of air, specific volume or the weight per unit volume of air, enthalpy or the relative energy content per unit weight of air, and a correction for varying atmospheric pressure. Psychrometric charts that cover higher and lower temperature ranges are also available, as are computer-based charts or calculation procedures.
The author would like to acknowledge the contributions of Gerald R. Bodman, co-author of the original edition of this publication.
This publication has been peer reviewed.