G1426
Using Ultrasonic Flow Meters in Irrigation Applications
This NebGuide reports on recent research to help ultrasonic flow meter users adjust inaccurate measurements.
Dean E. Eisenhauer, Professor, Biological Systems Engineering
- Introduction
- Ultrasonic Flow Meter Performance Research
- Ultrasonic Flow Meter Performance
- Correcting Flow rate measurements
- Conclusions and Recommendations
- References
- Acknowledgments
Introduction
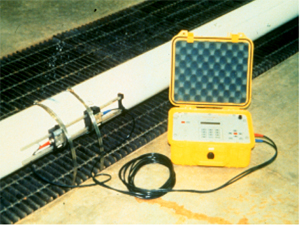
Irrigation is no different from any other crop production input; to be managed effectively and economically it must be measured accurately. Several devices exist to measure water flow in pipelines. A relatively new alternative is the ultrasonic flowmeter. The USFM is a non-invasive device that can be used to measure both flow rate and volume. Clamp-on transducers eliminate in-line installation, allowing one meter to be used at many locations (Figure 1). Exterior installation eliminates pressure losses and prevents leaking that can be associated with in-line meter installations.
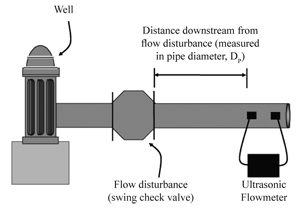
The transmission, or transit-time, ultrasonic flowmeter operates on the principle of phase shift. Two transducers act alternately as transmitter and receiver as two paths of sonic beams travel back and forth across the pipe (Figure 2). One beam travels downstream while the other moves upstream. The motion of the fluid causes a frequency shift in both waves. This shift is related to the velocity of the fluid. Research has shown that, when installed properly, USFM accuracy ranges from +/- 1 to +/- 5 percent of full scale.
 |
 |
|
| Figure 1. Transit-time ultrasonic flow meter. | Figure 2. Transit-time ultrasonic flow meter measurement technique. |
|
When measuring fluid in a pipeline, proper flow meter installation is one of the most important requirements for accurate flow measurement. This is true for any type of meter. As water passes through valves, pumps, reducers, tees, and elbows, it is agitated and sometimes sent into a swirling motion. It is difficult to accurately measure water that is agitated and swirling. To ensure that fluid flowing past the measuring location is “well conditioned” (undisturbed), meters should be installed with a sufficiently long section of straight, unobstructed pipe upstream from the meter location. Unobstructed upstream distances often are measured in terms of pipe diameters, Dp (Figure 3). For example, if one were measuring flow in an eight-inch pipe, 5 Dp (five pipe diameters) equals 40 inches. Table I shows a range of pipe sizes and the corresponding lengths for several values of Dp.
Most common meter location recommendations call for a minimum of five to 10 straight Dp free of obstructions upstream from the meter and at least one straight Dp free of obstructions downstream from the meter. If these requirements cannot be met, the piping conditions are “non-ideal” for flow measurement. A common problem found in irrigation-well meter installations is that the upstream unobstructed, straight pipe length recommendation cannot be met and metering often is done in a non-ideal piping configuration.
The popularity of ultrasonic flowmeters is due in large part to their portability and ease of use; they can be installed almost anywhere. Nonetheless, it is important to adhere to proper installation guidelines. The purpose of this NebGuide is to report on recent research that will help ultrasonic flow meter users adjust inaccurate flow rate measurements that, because of pre-existing conditions, are collected under non-ideal piping configurations.
| Table I. Dp (pipe diameters) lengths for the range of pipe sizes commonly found in irrigation systems. | ||||
Pipe Diameters (Dp) |
Pipe diameter (in.) |
|||
4 |
6 |
8 |
10 |
|
Distance (in.) |
||||
2 4 6 8 10 15 20 |
8 16 24 32 40 60 80 |
12 24 36 48 60 90 120 |
16 32 48 64 80 120 160 |
20 40 60 80 100 150 200 |
Ultrasonic Flow Meter Performance Research
For this research three flow-disturbing devices were used — a 90° elbow, a spring-loaded swing check valve and a butterfly valve. These devices were arranged to produce five different flow-disturbing configurations (Table II). Table III shows the tested combinations of pipe material, diameter, and flow disturbance. The 6-inch steel and 6-inch PVC pipe were used to evaluate the extremes of pipe roughness normally found in irrigation systems. For comparison purposes, four flow rates typically found in irrigation systems (220, 440, 660, and 880 gpm) were evaluated. A Polysonics Model ISTT-P portable transit-time USFM was used for this experiment. Flow rate measurements were taken at 2, 4.5, 10, 22, and 50 Dp downstream from the flow disturbance.
| Table II. Test configurations. | |
| Abbreviation | Configuration, Flow disturbing device |
SEL |
Single Elbow |
2EL |
2 Elbows in different planes* |
CHK |
Swing Check Valve |
BV5 |
Butterfly Valve, vertical axis 50% open |
BH5 |
Butterfly Valve, horizontal axis 50% open |
| *Used to simulate the transition from an underground supply line to the upright of a pivot riser. | |
| Table III. Tested combinations of flow disturbance devices, pipe sizes, and pipe materials. | ||||||
| Material | Tested pipe sizes and devices |
|||||
Diameter (in.) |
SEL |
2EL |
CHK |
BH5 |
BV5 |
|
| PVC PVC Steel Aluminum |
6 8 6 6 |
x x x x |
x — x — |
x — x — |
x — x — |
x — x — |
|
Precision is that portion of the overall accuracy that is the result of random errors out of the user’s control. As users of the ultrasonic meter, we can do little to correct for random errors; it is simply a measurement uncertainty that must be acknowledged. Recall that previous research has shown that, when installed properly, (i.e. with no systematic installation bias) ultrasonic flow meter accuracy ranges from +/- 1 to +/- 5 percent of full scale.
Ultrasonic Flow Meter Performance
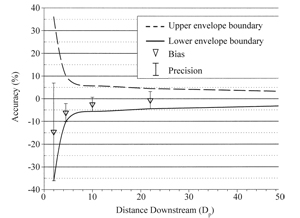
To characterize ultrasonic flow meter performance, an accuracy or performance envelope was developed (Figure 4). Statistical analyses of USFM performance indicated that, at a particular downstream distance, there was no difference in USFM performance across the tested combinations. Figure 4 shows the average USFM performance when installed from 2 to 50 Dp downstream from the types of flow-disturbing devices shown in Table II. The performance envelope incorporates both the bias and precision associated with the tested configurations of flow disturbance, pipe material and flow rate. Although Figure 5 shows that the USFM bias for the tested devices was generally negative, bias can be either negative (under prediction) or positive (over prediction). As a result, performance envelopes are always drawn around the axis of perfect accuracy – zero percent inaccuracy. Accuracy estimates are, therefore, stated in terms of plus or minus (+/-) some percentage of the USFM reading. Figure 4 illustrates that when using the USFM at 2 Dp downstream from the types of flow disturbance evaluated here, the bounds of the accuracy envelope and thus the potential inaccuracy of a given measurement can be as much as +/- 36 percent.
Examining Figure 4 more closely, we see that the bias at 2 Dp is a negative 15 percent. In other words, the ultrasonic flow meter systematically under predicted the actual flow rate by some 15 percent. The imprecision at 2 Dp was +/- 21 percent. That means that the range of measurements collected at 2 Dp was +/- 21 percent of the average USFM reading. As one might expect, as distance downstream from the flow disturbance increases, USFM performance improves. At 50 Dp the USFM exhibited essentially no directional bias and the precision had improved to less than +/-2 percent. Based on these results, its clear that meter location is critical to measurement accuracy. But what if meter locations are restricted to positions very near a flow disturbance? Using the bias and precision data just illustrated, a flow measurement correction approach was developed.
Correcting Flow rate measurements
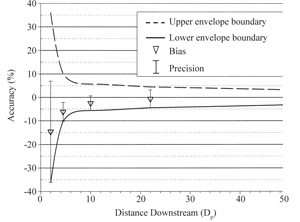
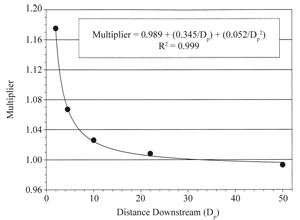
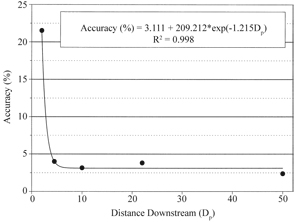
To correct for the negative bias shown in Figure 4, a bias-correcting multiplier was developed. Figure 5 shows the multiplier relationship as it varies with distance downstream from a flow disturbance. The equation shown in Figure 5 can be used to predict a bias-correcting multiplier at any downstream measurement location between 2 and 50 Dp. Even after the bias of a particular flow measurement is corrected, a certain level of imprecision due to random error remains. That degree of uncertainty is characterized in Figure 6, which shows the corresponding accuracy for an ultrasonic flow meter reading after the bias-correcting multiplier has been applied. Developed from Figures 5 and 6, Table IV contains multiplier and accuracy values for some specific Dp values. The following example shows how to use Table IV to adjust inaccurate USFM measurements.
In this example, assume the USFM is mounted 6 Dp downstream from the flow disturbance in this case, a swing check valve. If this system were plumbed using 8-inch pipe, 6 Dp would be equal to 48 inches (Table I). The distance between the swing check valve and meter is measured from the downstream flange of the check valve to the upstream USFM transducer. For this example assume that the USFM reads 837 gpm. If we look in Table IV for Dp = 6, the multiplier equals 1.05 and the accuracy equals +/- 3%.
| Table IV. Multiplier and accuracy values at selected pipe diameters (Dp) | ||
Distance Downstream from Flow Disturbance (Dp) |
Multiplier (dimensionless) |
Accuracy after adjustment (+/-, %) |
2 3 4 5 6 7 8 9 10 15 20 30 40 50 |
1.15 1.10 1.07 1.06 1.05 1.04 1.03 1.03 1.02 1.01 1.01 1.00 1.00 1.00 |
20 9 5 4 3 3 3 3 3 3 3 3 3 3 |
Applying the bias-correcting multiplier to the USFM flow reading gives the Adjusted Flow Rate.
Adjusted Flow Rate = 1.05 x 837 gpm = 879 gpm
Applying the accuracy value for Dp = 6 (+/- 3%) gives an adjusted measurement accuracy range of 853 to 905 gpm. The design flow rate for the irrigation system measured in the example was 880 gpm. This example and two others are shown in Table V.
| Table V. Example of ultrasonic flow measurement adjustment and accuracy. | ||||||
Measured Flow Rate (gpm) |
Location (PD) |
Accuracy pre- adjustment (+/-, %) |
Multiplier |
Adjusted Flow Rate (gpm) |
Accuracy post- adjustment (+/-, %) |
Accuracy range of adjusted flow rate (gpm) |
758 |
2.0 |
35 |
1.15 |
872 |
20 |
1046 - 697 |
795 |
3.5 |
19 |
1.08 |
859 |
7 |
919 - 799 |
837 |
6.0 |
7 |
1.05 |
879 |
3 |
905 - 853 |
Conclusions and Recommendations
For the flow disturbances evaluated here (Table II), the USFM consistently under-predicted the actual flow near the flow disturbance and became more accurate as the distance downstream from flow disturbance increased (Figure 4). Based upon these results, we recommend, if at all possible, the USFM be installed with at least 10 Dp of straight, unobstructed pipe upstream from the measurement location. In circumstances where the USFM must be installed closer than 10 Dp, the bias-correction method presented here can be used to find a more accurate flow rate and assess the accuracy of that adjusted measurement. The reader should note that the correction multipliers presented here apply only to those flow disturbing devices listed in Table II.
References
Johnson, A.L., B.L. Benham, D.E. Eisenhauer, and R.H. Hotchkiss. 2000 Ultrasonic water measurement in irrigation pipelines with disturbed flow. University of Nebraska ARD Journal Series No. 13143.
Luckey, R., F. Heimes and N. Gaggiani. 1980. Calibration and Testing of Selected Portable Flow Meters for Use on Large Irrigation Systems. Water Resources Investigations 80-72. U.S. Geological Survey.
Miller, R.W. 1989. Flow Measurement Engineering Handbook. New York, NY: McGraw-Hill.
Omega Engineering Inc. 1992. Complete Flow and Level Measurement Handbook and Encyclopedia, Vol. 28. Stanford, CT: Omega Engineering Incorporated.
Replogle, J.A., A.J. Clemmens, and M.G. Bos. 1990. Measuring Irrigation Water, pp. 315-370. In: Riezenman, M.J. 1989. Ultrasonic Meters Go With the Flow. Mechanical Engineering, 111(9):74-77.
Upp, E.L. 1993. Fluid Flow Measurement: A Practical Guide to Accurate Flow Measurement. Gulf Publishing Company, Daniel Industries.
Acknowledgments
The lead author on the original publication of this NebGuide is Brian L. Benham, Associate Professor, Biological Systems Engineering at Virginia Tech University.
Visit the University of Nebraska–Lincoln Extension Publications Web site for more publications.
Index: Irrigation Engineering
Irrigation Operations & Management
2001, Revised March 2008